Glucose
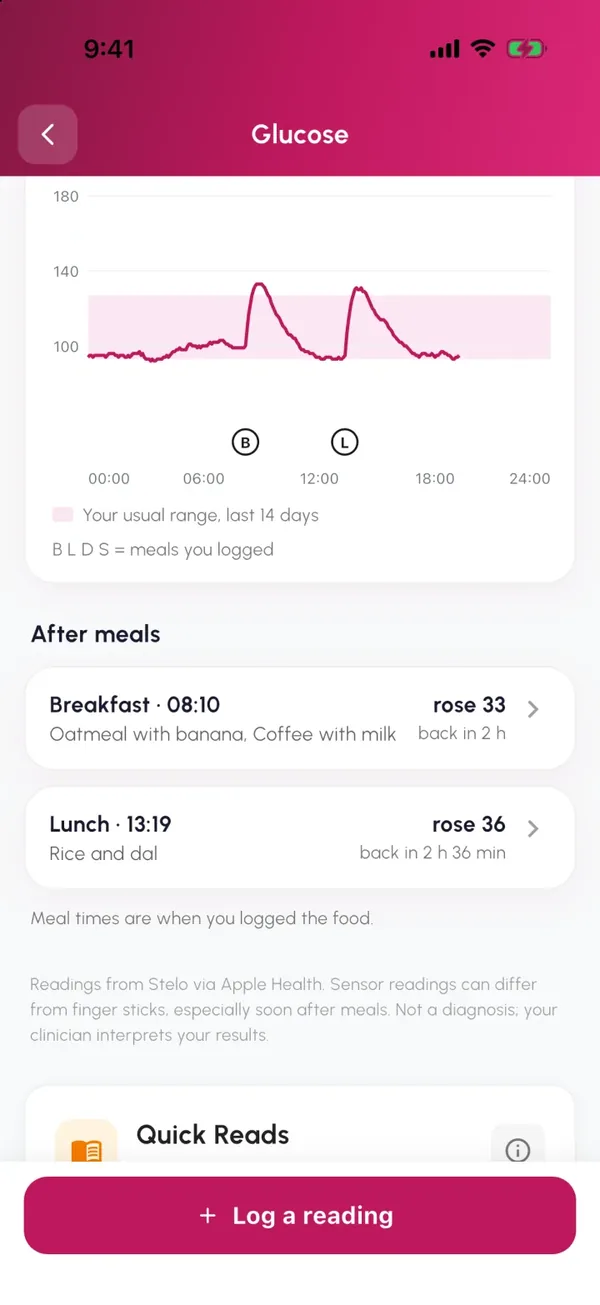
Every meal, marked on your curve.
Readings from your CGM or meter come in through Apple Health, or type in a fingerstick. Each logged meal is marked on the curve, with how far it rose and how long it took to settle.
- Any CGM or meter, via Apple Health
- Each meal’s rise and recovery time
- Your usual range, shaded
Lunch settles slowest2 h 36 min after rice and dal
Meals
Log it in a sentence, a photo or a scan.
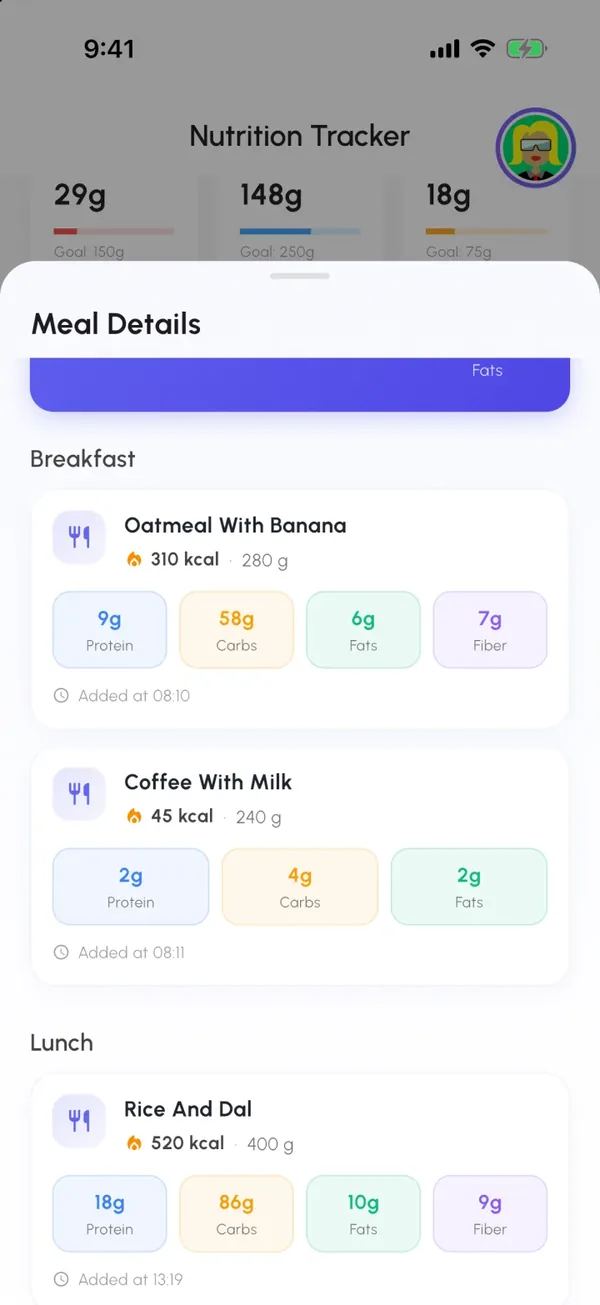
Describe what you ate or snap your plate. AI turns it into foods and portions you confirm, with carbs, protein, fat and fibre, so every rise has a meal next to it.
- Describe it, snap it or scan it
- Carbs, protein, fat and fibre
- Recent meals come back in one tap
86 g carbs at lunchagainst 58 g at breakfast
Patterns
What moves your glucose, in your own data.
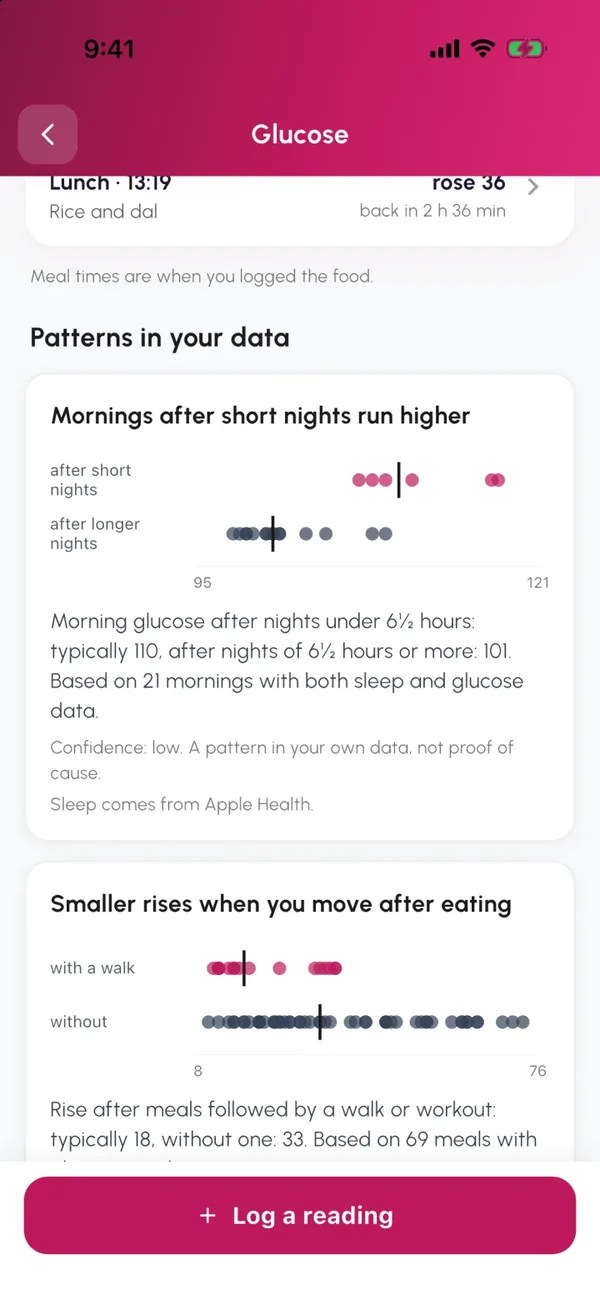
After a few weeks, PeakRoutine checks your last 28 days for what tends to move your numbers: short nights, walks after meals, stressful days. Each pattern shows every day it used.
- Sleep, walks and stress, compared
- Every pattern shows the days behind it
- Plain words when there isn’t enough data
110 vs 101 mg/dLmornings after short vs longer nights
Lab results
Your A1c, explained visit to visit.
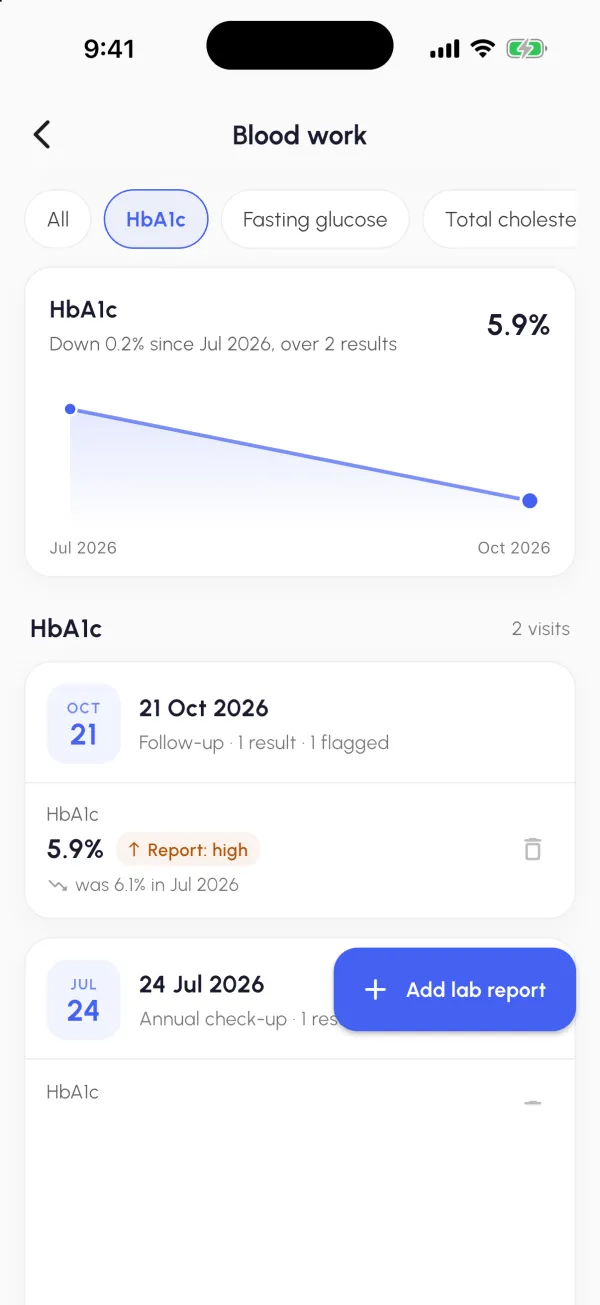
Photograph the report or upload the PDF. You check every value before it’s saved, then see HbA1c, fasting glucose and cholesterol change between visits, with a reminder when it’s time to retest.
- Photo or PDF, checked by you
- HbA1c, fasting glucose and lipids over time
- A reminder about 90 days after your last test
HbA1c trending down6.1% to 5.9% since July
Energy
How you feel counts too.
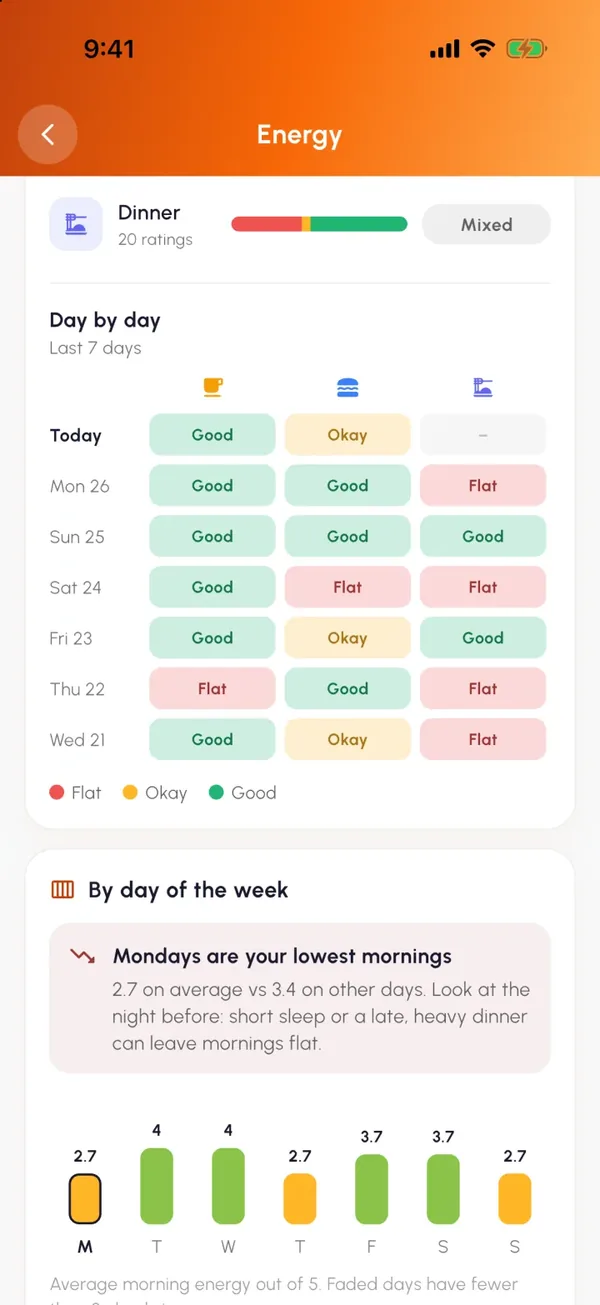
One tap in the morning and one in the evening. With or without a sensor, a few weeks of check-ins show which meals and which days tend to leave you flat.
- Morning and evening check-ins
- How each meal left you feeling
- Your week, day by day
Monday mornings run lowestenergy 2.7 vs 3.4 out of 5